AI Sales Territory Analysis Generator
Is this tool helpful?
How to Use the AI Sales Territory Analysis Generator Effectively
Step-by-Step Guide to Using the Tool
You can optimize your sales territory management by following these steps when using the AI Sales Territory Analysis Generator:
- Upload Sales Data: Upload a CSV or Excel file containing your sales transactions. Make sure your data includes essential fields such as transaction date, sales amount, territory code, product SKU, and sales rep ID. For example, you might upload a file with 8,000 sales entries from February 2022 to February 2023, or another showing 12,000 transactions from a recent product launch.
- Upload Territory Data: Provide a CSV or Excel file with territory definitions. Include territory codes and corresponding geographic or demographic attributes. You might upload a file defining 30 sales territories in a metropolitan area or a different one with 70 territories across multiple states.
- Select Analysis Metrics: Choose the KPIs you want to examine. Options include Sales Growth Rate, Market Penetration, Average Order Value, and Customer Coverage Ratio. For example, select “Average Order Value” and “Customer Coverage Ratio” if you’re focusing on revenue per customer and coverage effectiveness.
- Choose AI Analysis Type: Pick your AI analysis method. Options are Predictive Forecasting, Trend Analysis, and Customer Segmentation. Selecting “Trend Analysis” helps identify emerging sales patterns, while “Customer Segmentation” clusters customers to reveal targeted market opportunities.
- Specify Date Range: Enter the time frame for your analysis using date pickers. For instance, analyze data from March 1, 2022, to February 28, 2023, or a shorter range like June 1 to December 31, 2022, for seasonal trends.
- Select Territories (Optional): Focus on particular territories by selecting one or more from the list. You might analyze “Midwest Region” or “Pacific Northwest” territories separately to compare regional performance.
- Upload Customer Data (Optional): For deeper analysis, upload a file with customer information such as customer ID, industry classification, company size, and contact details. Examples include customer data for 3,000 enterprise clients or detailed profiles for 7,500 small-to-medium businesses.
- Anonymize Data (Optional): Check the box if you want to anonymize sensitive data to comply with privacy rules before processing.
- Generate Analysis: Click the analyze button to produce AI-driven insights based on your inputs.
Interpreting Your Analysis Results
After the tool processes your data, you’ll see a detailed report that includes:
- Clear charts and graphs visualizing key sales metrics over the selected time frame
- AI-generated predictions and trend insights tailored to your territories
- Comparative reports highlighting strengths and weaknesses between territories
- Customer segmentation breakdowns for targeted marketing strategies
- Actionable recommendations to improve sales effectiveness and territory coverage
Review the insights carefully and use them to refine your sales approaches and better allocate resources across territories.
Understanding the AI Sales Territory Analysis Generator
What This Tool Does and Why It Matters
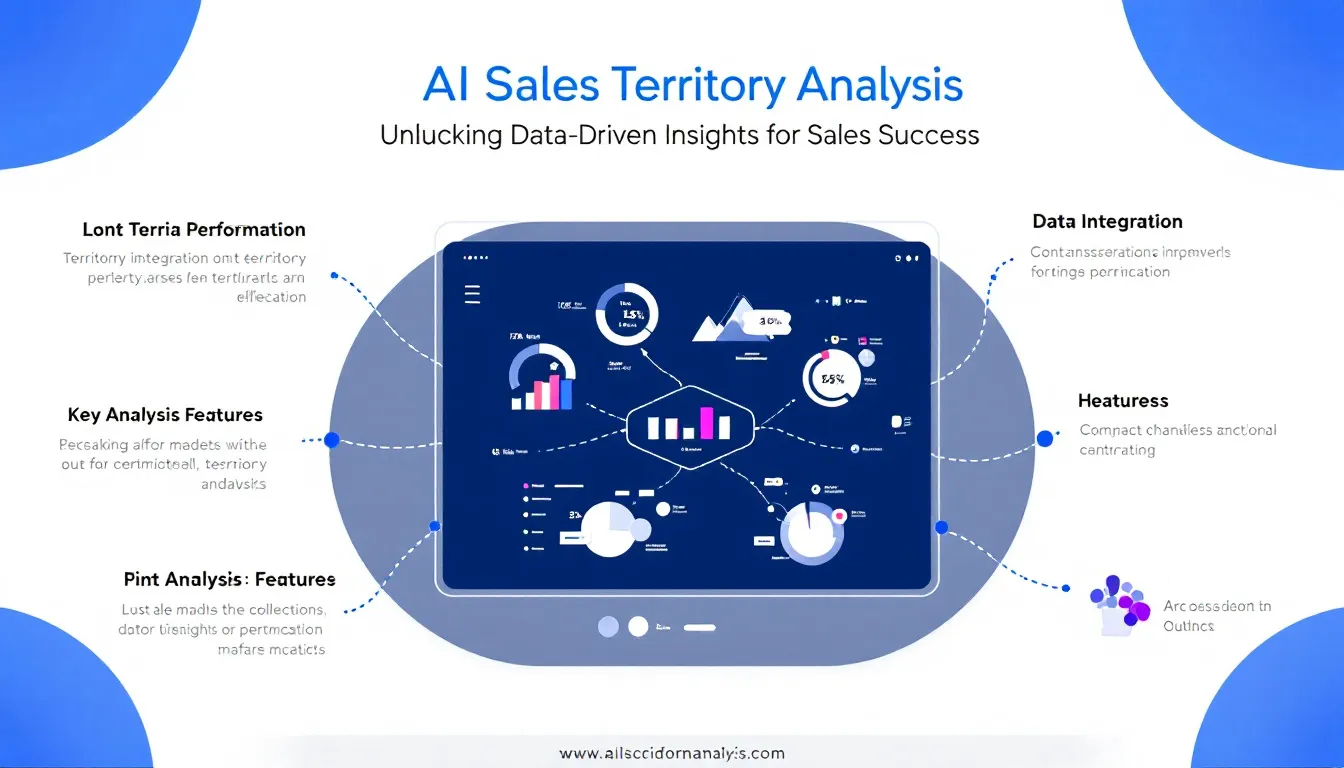
The AI Sales Territory Analysis Generator transforms your raw sales and territory data into valuable insights by leveraging advanced machine learning algorithms. This AI-driven tool helps sales teams and managers make informed decisions on optimizing territories, allocating resources, and targeting customers more effectively.
Key Features of the Tool
- Data Integration: Combines sales transactions, territory boundaries, and optional customer details into a unified analysis.
- AI-Powered Analytics: Applies machine learning techniques to detect patterns, forecast sales, and segment customer groups.
- Custom Metrics Selection: Lets you focus your analysis on specific KPIs that align with your business goals.
- Forecasting Capabilities: Predicts future sales trends per territory using historical data and market variables.
- Visual Reports: Produces intuitive charts and dashboards that simplify complex data interpretation.
Benefits of AI-Driven Sales Territory Analysis
This tool helps your sales organization achieve:
- Better Decision Making: Access accurate and up-to-date insights to guide strategic sales moves.
- Efficient Resource Allocation: Identify high-potential territories and address underperforming areas with precision.
- Higher Sales Productivity: Focus sales efforts on territories and customers with the best opportunity for growth.
- Enhanced Customer Targeting: Understand customer segments to personalize your sales engagement.
- Proactive Planning: Anticipate market shifts and adapt your strategies ahead of time.
- Performance Benchmarking: Compare results across territories and teams to identify best practices.
Practical Usage of the AI Sales Territory Analysis Generator
Applying Your Sales Data for Actionable Insights
Use this tool to transform your sales data into strategic advantages by following these practical applications:
1. Optimizing Territory Boundaries
The AI evaluates customer locations, sales potentials, and geographical factors to recommend balanced territory divisions. For example, a business with 800 customers scattered across three regions might receive suggestions to split these into four balanced territories for better coverage.
$$ \text{Territory Balance Score} = \frac{\text{Number of Priority Customers}}{\text{Total Customers}} \times 100 $$The formula ensures each territory maintains a comparable share of high-value customers, promoting fairness among sales representatives.
2. Identifying Underperforming Territories
The tool compares actual sales to predicted potential sales, flagging territories where performance lags. If Territory X records $400,000 but predicted sales equal $600,000, the tool highlights a 33.33% performance gap for review:
$$ \text{Performance Gap (\%)} = \frac{\text{Predicted Sales} – \text{Actual Sales}}{\text{Predicted Sales}} \times 100 $$3. Forecasting Future Sales
Using machine learning models and past trends, the AI predicts sales growth or decline for upcoming periods. If Territory Y had $900,000 in the last quarter and the forecasted growth is 10%, the tool calculates projected sales:
$$ \text{Forecasted Sales} = \text{Current Sales} \times (1 + \text{Predicted Growth Rate}) $$This results in anticipated sales of $990,000, helping you set realistic goals and allocate resources efficiently.
4. Customer Segmentation and Market Targeting
Clustering algorithms group customers by behavior and attributes within territories. For example, the AI could identify a segment of tech startups with high purchase frequency in Territory Z, allowing your sales team to tailor offers and messaging specifically to that group.
5. Optimizing Sales Team and Budget Allocation
By analyzing territory potential and complexity, the AI suggests how many sales reps each territory requires and how to distribute marketing resources. For example, if Territory W has a potential market size of $3,600,000, an average rep sales capacity of $900,000, and an adjustment factor of 1.1, the recommended sales reps are:
$$ \text{Recommended Sales Reps} = \frac{\text{Territory Potential Sales}}{\text{Average Sales per Rep}} \times \text{Adjustment Factor} $$This results in 4.4 reps, which you can round to 4 or 5 for practical staffing decisions.
Leveraging these insights helps you balance workload, improve sales coverage, and invest marketing budgets where they drive the biggest returns.
Important Disclaimer
The calculations, results, and content provided by our tools are not guaranteed to be accurate, complete, or reliable. Users are responsible for verifying and interpreting the results. Our content and tools may contain errors, biases, or inconsistencies. Do not enter personal data, sensitive information, or personally identifiable information in our web forms or tools. Such data entry violates our terms of service and may result in unauthorized disclosure to third parties. We reserve the right to save inputs and outputs from our tools for the purposes of error debugging, bias identification, and performance improvement. External companies providing AI models used in our tools may also save and process data in accordance with their own policies. By using our tools, you consent to this data collection and processing. We reserve the right to limit the usage of our tools based on current usability factors.
